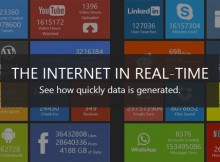
The folks over at pennystocks have put together this mesmerizing infographic that shows just how far down the rabbit hole of the internet we are. From watching streaming video to social media, to shopping and blogging, there is a staggering amount of data being transferred over the Internet.
Every second there is simply an overwhelming amount of activity and this graphic details it in mind bending clarity. Everything from the amount of ad revenue Google makes, to Instagram uploads, to Tweets, to how much money is spent on Amazon.
I think the only missing is the number of quiz plays on Sporcle. Someone should really get on that.

Click the animation to open the full version (via http://pennystocks.la).


